Team B || Continuous Delivery with Jenkins in Kubernetes Engine
Team B || Continuous Delivery with Jenkins in Kubernetes Engine
Overview
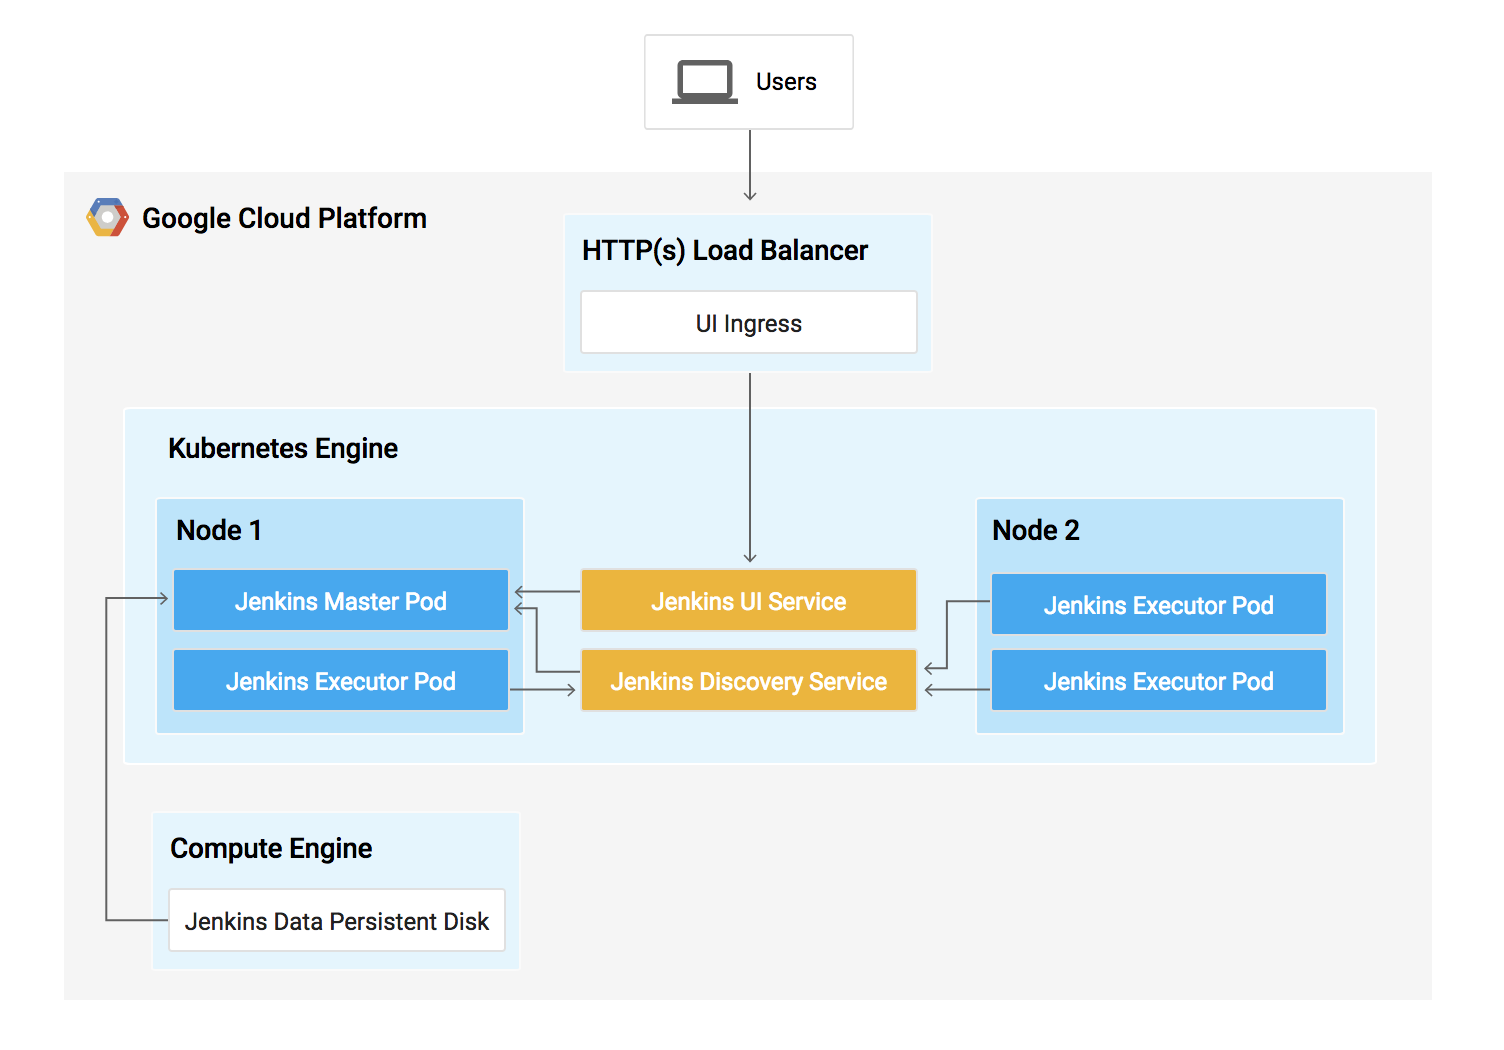
In this lab, you will learn how to set up a continuous delivery pipeline with Jenkins on Kubernetes engine. Jenkins is the go-to automation server used by developers who frequently integrate their code in a shared repository. The solution you'll build in this lab will be similar to the following diagram:
(Optional) You can list the active account name with this command:
gcloud auth list
gcloud config list project
To get set up, open a new session in Cloud Shell and run the following command to set your zone <filled in at lab start>
Then copy the lab's sample code:
Now change to the correct directory:
Task 2. Provisioning Jenkins
Creating a Kubernetes cluster
Now, run the following command to provision a Kubernetes cluster:
This step can take up to several minutes to complete. The extra scopes enable Jenkins to access Cloud Source Repositories and Google Container Registry.
Before continuing, confirm that your cluster is running by executing the following command:
gcloud container clusters listNow, get the credentials for your cluster:
gcloud container clusters get-credentials jenkins-cdKubernetes Engine uses these credentials to access your newly provisioned cluster—confirm that you can connect to it by running the following command:
kubectl cluster-infoTask 3. Setup Helm
In this lab, you will use Helm to install Jenkins from the Charts repository. Helm is a package manager that makes it easy to configure and deploy Kubernetes applications. Once you have Jenkins installed, you'll be able to set up your CI/CD pipeline.
Add Helm's stable chart repo:
helm repo add jenkins https://charts.jenkins.ioEnsure the repo is up to date:
helm repo updateWhen installing Jenkins, a values file can be used as a template to provide values that are necessary for setup.
You will use a custom values file to automatically configure your Kubernetes Cloud and add the following necessary plugins:
- Kubernetes:latest
- Workflow-multibranch:latest
- Git:latest
- Configuration-as-code:latest
- Google-oauth-plugin:latest
- Google-source-plugin:latest
- Google-storage-plugin:latest
This will allow Jenkins to connect to your cluster and your GCP project.
Use the Helm CLI to deploy the chart with your configuration settings:
2. This command may take a couple minutes to complete.
Once that command completes ensure the Jenkins pod goes to the
Runningstate and the container is in the READY state:
kubectl get podsExample Output:
NAME                          READY     STATUS    RESTARTS   AGE
cd-jenkins-7c786475dd-vbhg4   2/2       Running   0          1m
Configure the Jenkins service account to be able to deploy to the cluster:
kubectl create clusterrolebinding jenkins-deploy --clusterrole=cluster-admin --serviceaccount=default:cd-jenkinsYou should receive the following output:
clusterrolebinding.rbac.authorization.k8s.io/jenkins-deploy createdRun the following command to setup port forwarding to the Jenkins UI from the Cloud Shell:
export POD_NAME=$(kubectl get pods --namespace default -l "app.kubernetes.io/component=jenkins-master" -l "app.kubernetes.io/instance=cd" -o jsonpath="{.items[0].metadata.name}")
kubectl port-forward $POD_NAME 8080:8080 >> /dev/null &Now, check that the Jenkins Service was created properly:
kubectl get svcExample Output:
NAME               CLUSTER-IP     EXTERNAL-IP   PORT(S)     AGE
cd-jenkins         10.35.249.67           8080/TCP    3h
cd-jenkins-agent   10.35.248.1            50000/TCP   3h
kubernetes         10.35.240.1            443/TCP     9h
You are using the Kubernetes Plugin so that our builder nodes will be automatically launched as necessary when the Jenkins master requests them. Upon completion of their work, they will automatically be turned down and their resources added back to the clusters resource pool.
Notice that this service exposes ports 8080 and 50000 for any pods that match the selector. This will expose the Jenkins web UI and builder/agent registration ports within the Kubernetes cluster. Additionally, the jenkins-ui services is exposed using a ClusterIP so that it is not accessible from outside the cluster.
The Jenkins chart will automatically create an admin password for you. To retrieve it, run:
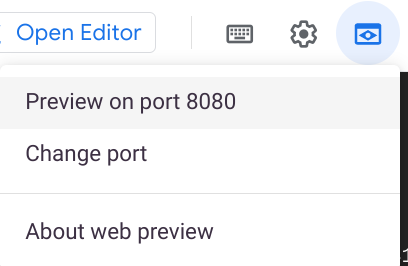
- To get to the Jenkins user interface, click on the Web Preview button in Cloud Shell, then click Preview on port 8080:
- If asked, log in with username
adminand your auto-generated password.
You now have Jenkins set up in your Kubernetes cluster! Jenkins will drive your automated CI/CD pipelines in the next sections.
Task 6. Understanding the Application
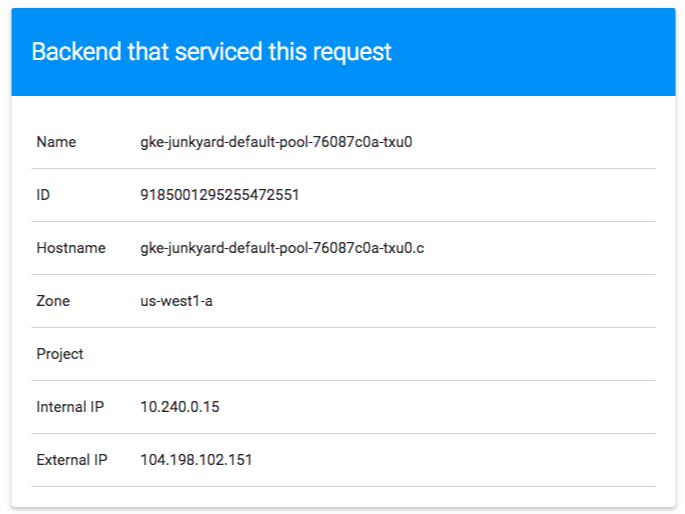
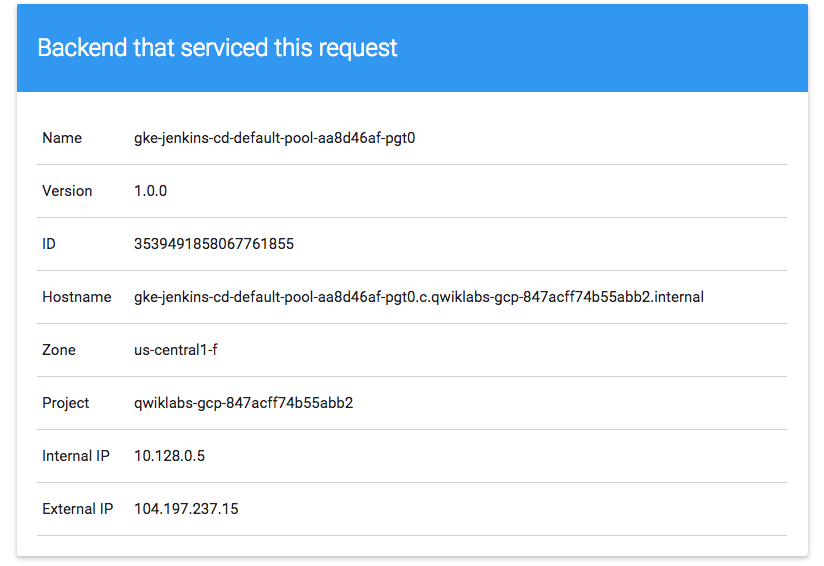
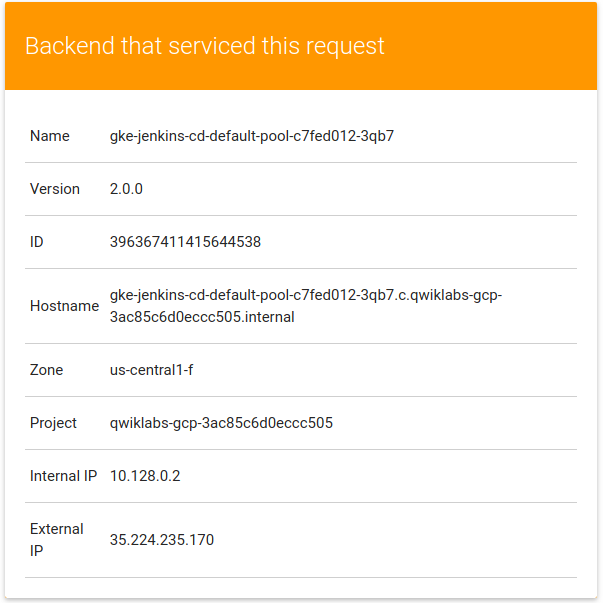
You'll deploy the sample application, gceme, in your continuous deployment pipeline. The application is written in the Go language and is located in the repo's sample-app directory. When you run the gceme binary on a Compute Engine instance, the app displays the instance's metadata in an info card.
The application mimics a microservice by supporting two operation modes.
- In backend mode: gceme listens on port 8080 and returns Compute Engine instance metadata in JSON format.
- In frontend mode: gceme queries the backend gceme service and renders the resulting JSON in the user interface.
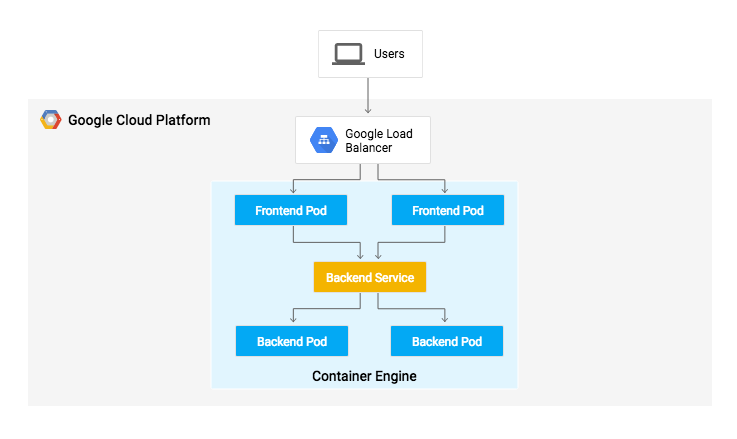
You will deploy the application into two different environments:
Production: The live site that your users access.
Canary: A smaller-capacity site that receives only a percentage of your user traffic. Use this environment to validate your software with live traffic before it's released to all of your users.
In Google Cloud Shell, navigate to the sample application directory:
Create the Kubernetes namespace to logically isolate the deployment:
Create the production and canary deployments, and the services using the
kubectl applycommands:
Scale up the production environment frontends by running the following command:
Now confirm that you have 5 pods running for the frontend, 4 for production traffic and 1 for canary releases (changes to the canary release will only affect 1 out of 5 (20%) of users):
Also confirm that you have 2 pods for the backend, 1 for production and 1 for canary:
Retrieve the external IP for the production services:
Example Output:
Paste External IP into a browser to see the info card displayed on a card—you should get a similar page:
Now, store the frontend service load balancer IP in an environment variable for use later:
Confirm that both services are working by opening the frontend external IP address in your browser.
Check the version output of the service by running the following command (it should read 1.0.0):
You have successfully deployed the sample application! Next, you will set up a pipeline for deploying your changes continuously and reliably.
Creating a repository to host the sample app source code
Create a copy of the
gcemesample app and push it to a Cloud Source Repository:
You can ignore the warning, you will not be billed for this repository.
Initialize the sample-app directory as its own Git repository:
Run the following command:
Set the username and email address for your Git commits. Replace
[EMAIL_ADDRESS]with your Git email address and[USERNAME]with your Git username:
Add, commit, and push the files:
Adding your service account credentials
Configure your credentials to allow Jenkins to access the code repository. Jenkins will use your cluster's service account credentials in order to download code from the Cloud Source Repositories.
In the Jenkins user interface, click Manage Jenkins in the left navigation then click Manage Credentials.
Click System.
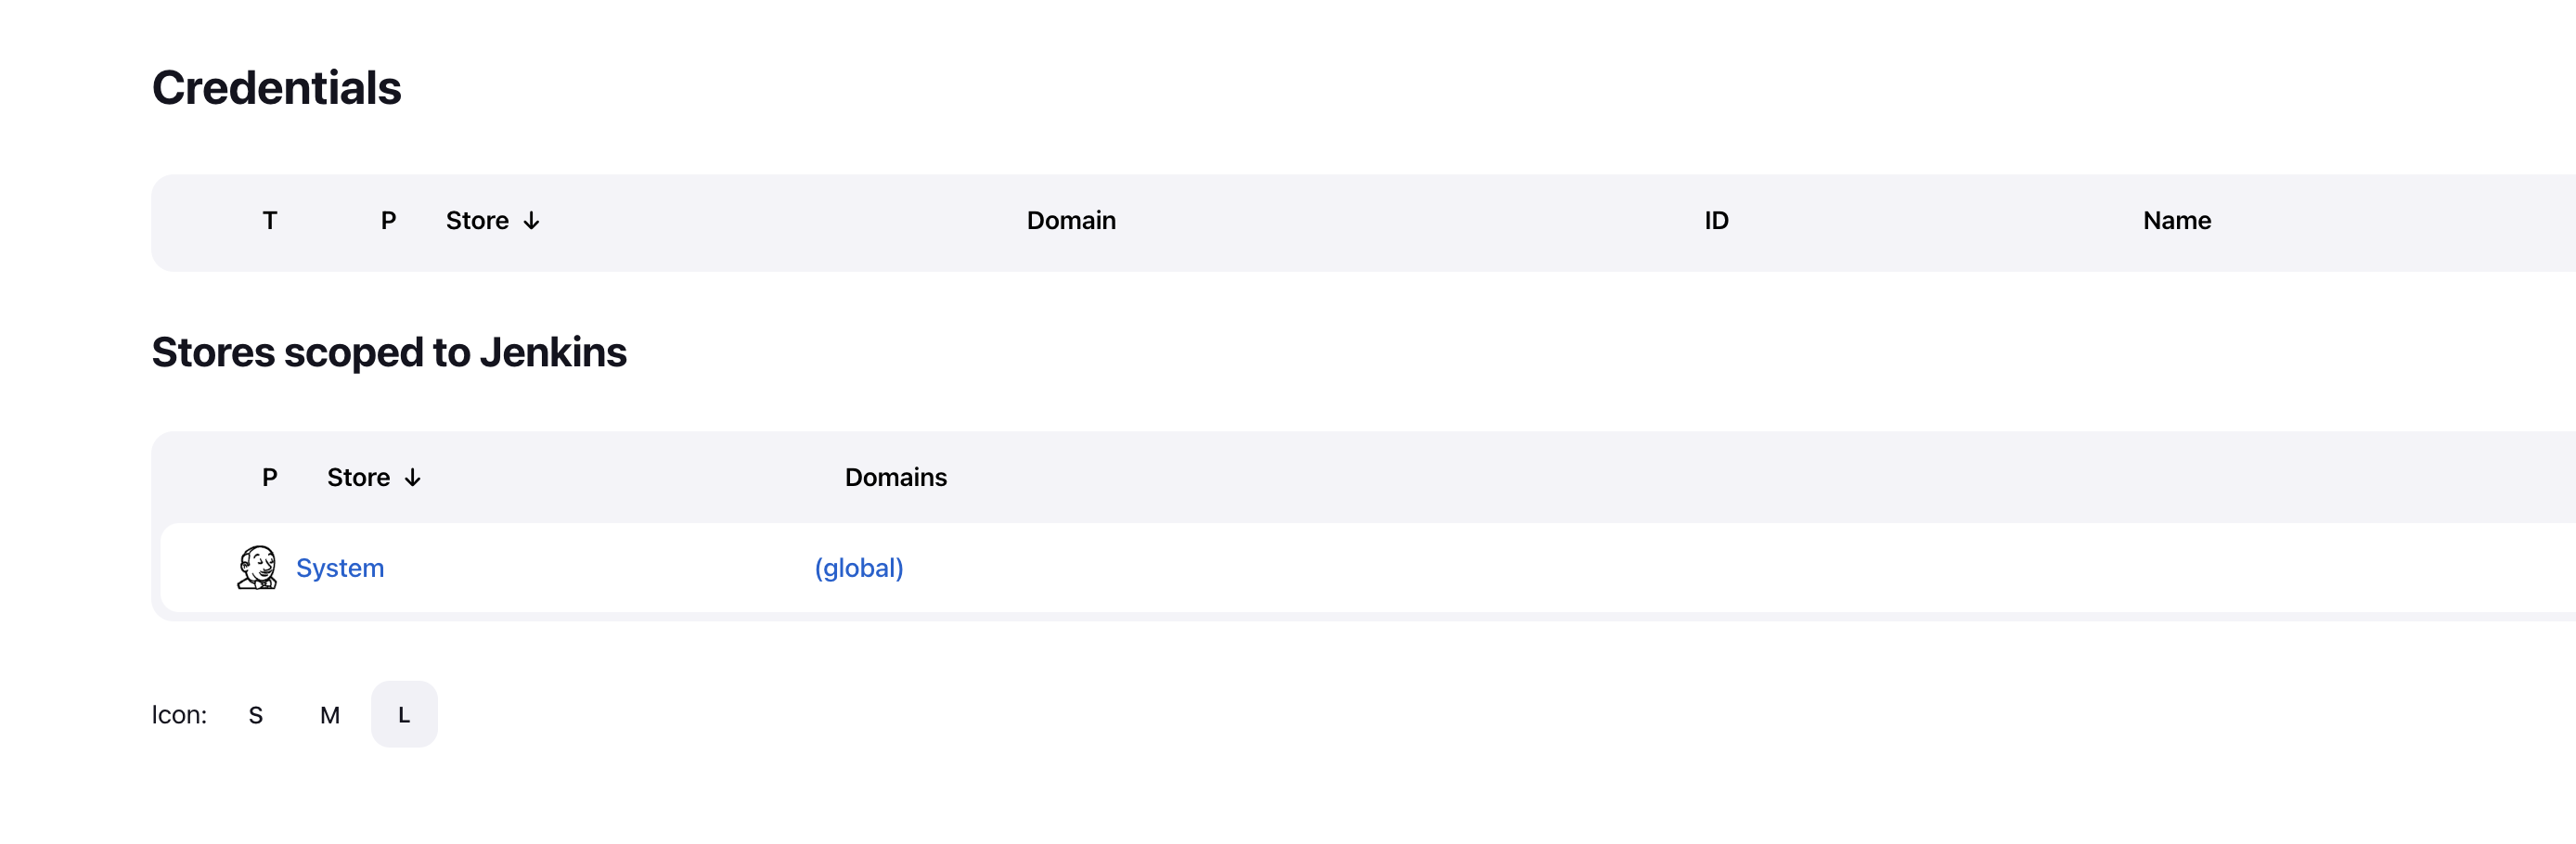
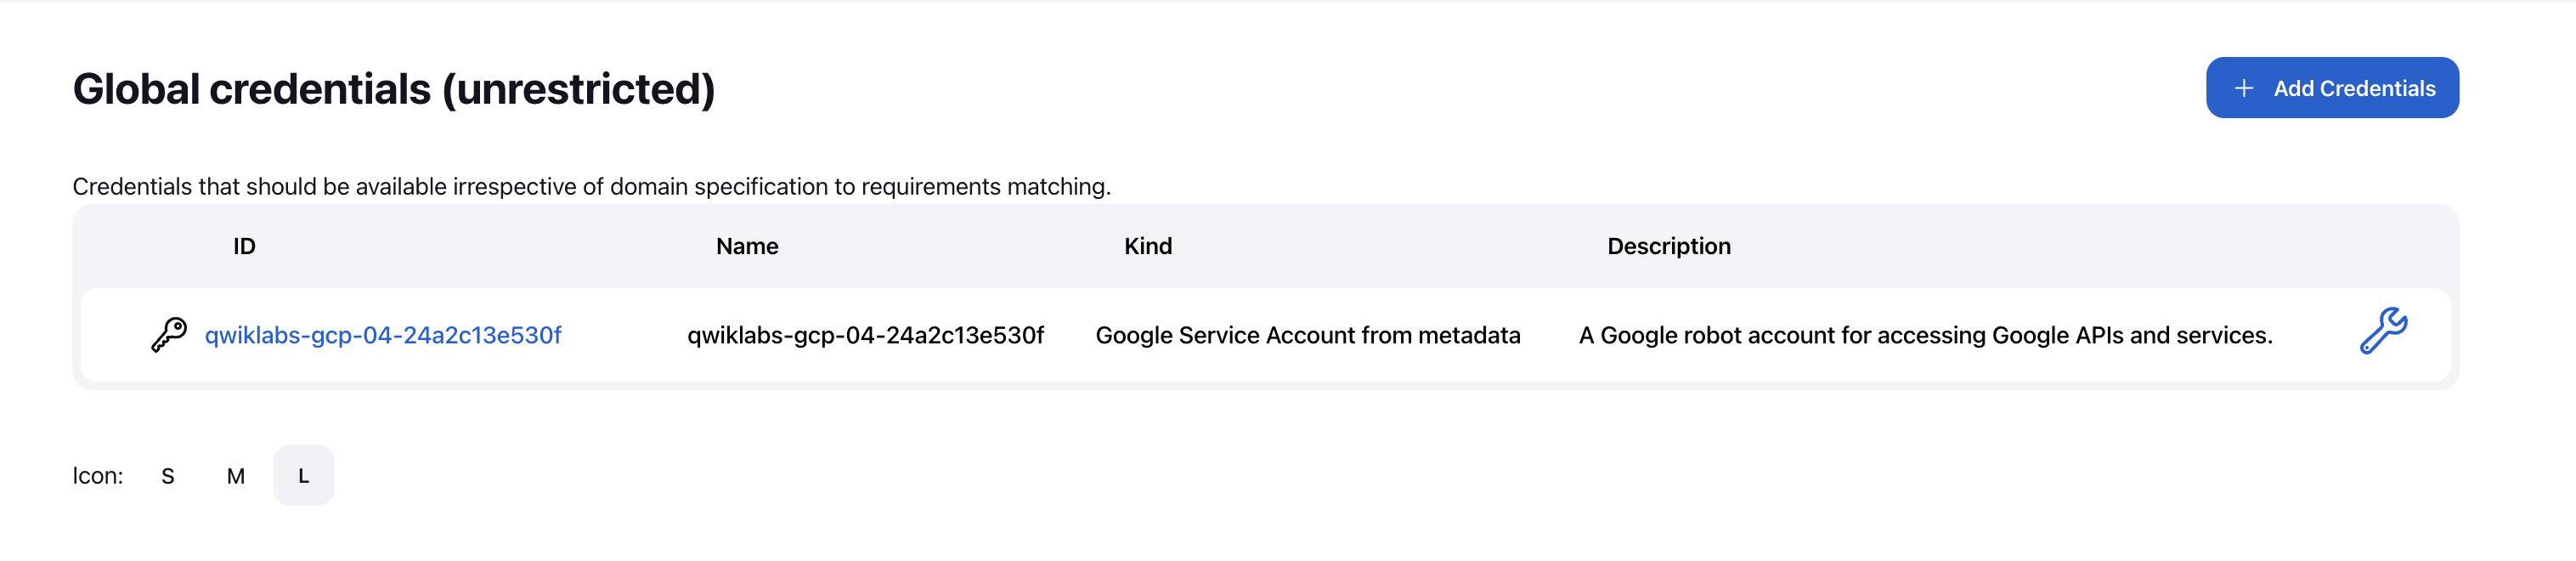
Click Global credentials (unrestricted).
Click Add Credentials in the top right corner.
Select Google Service Account from metadata from the Kind drop-down and click Create.
The global credentials has been added. The name of the credential is the Project ID found in the CONNECTION DETAILS section of the lab.
Configure Jenkins Cloud for Kubernetes
In the Jenkins user interface, select Manage Jenkins > Manage nodes and clouds.
Click Configure Clouds in the left navigation pane.
Click Add a new cloud and select Kubernetes.
Click Kubernetes Cloud Details.
In the Jenkins URL field, enter the following value:
http://cd-jenkins:8080In the Jenkins tunnel field, enter the following value:
cd-jenkins-agent:50000Click Save.
Creating the Jenkins job
Navigate to your Jenkins user interface and follow these steps to configure a Pipeline job.
Click Dashboard > New Item in the left panel.
Name the project sample-app, then choose the Multibranch Pipeline option and click OK.
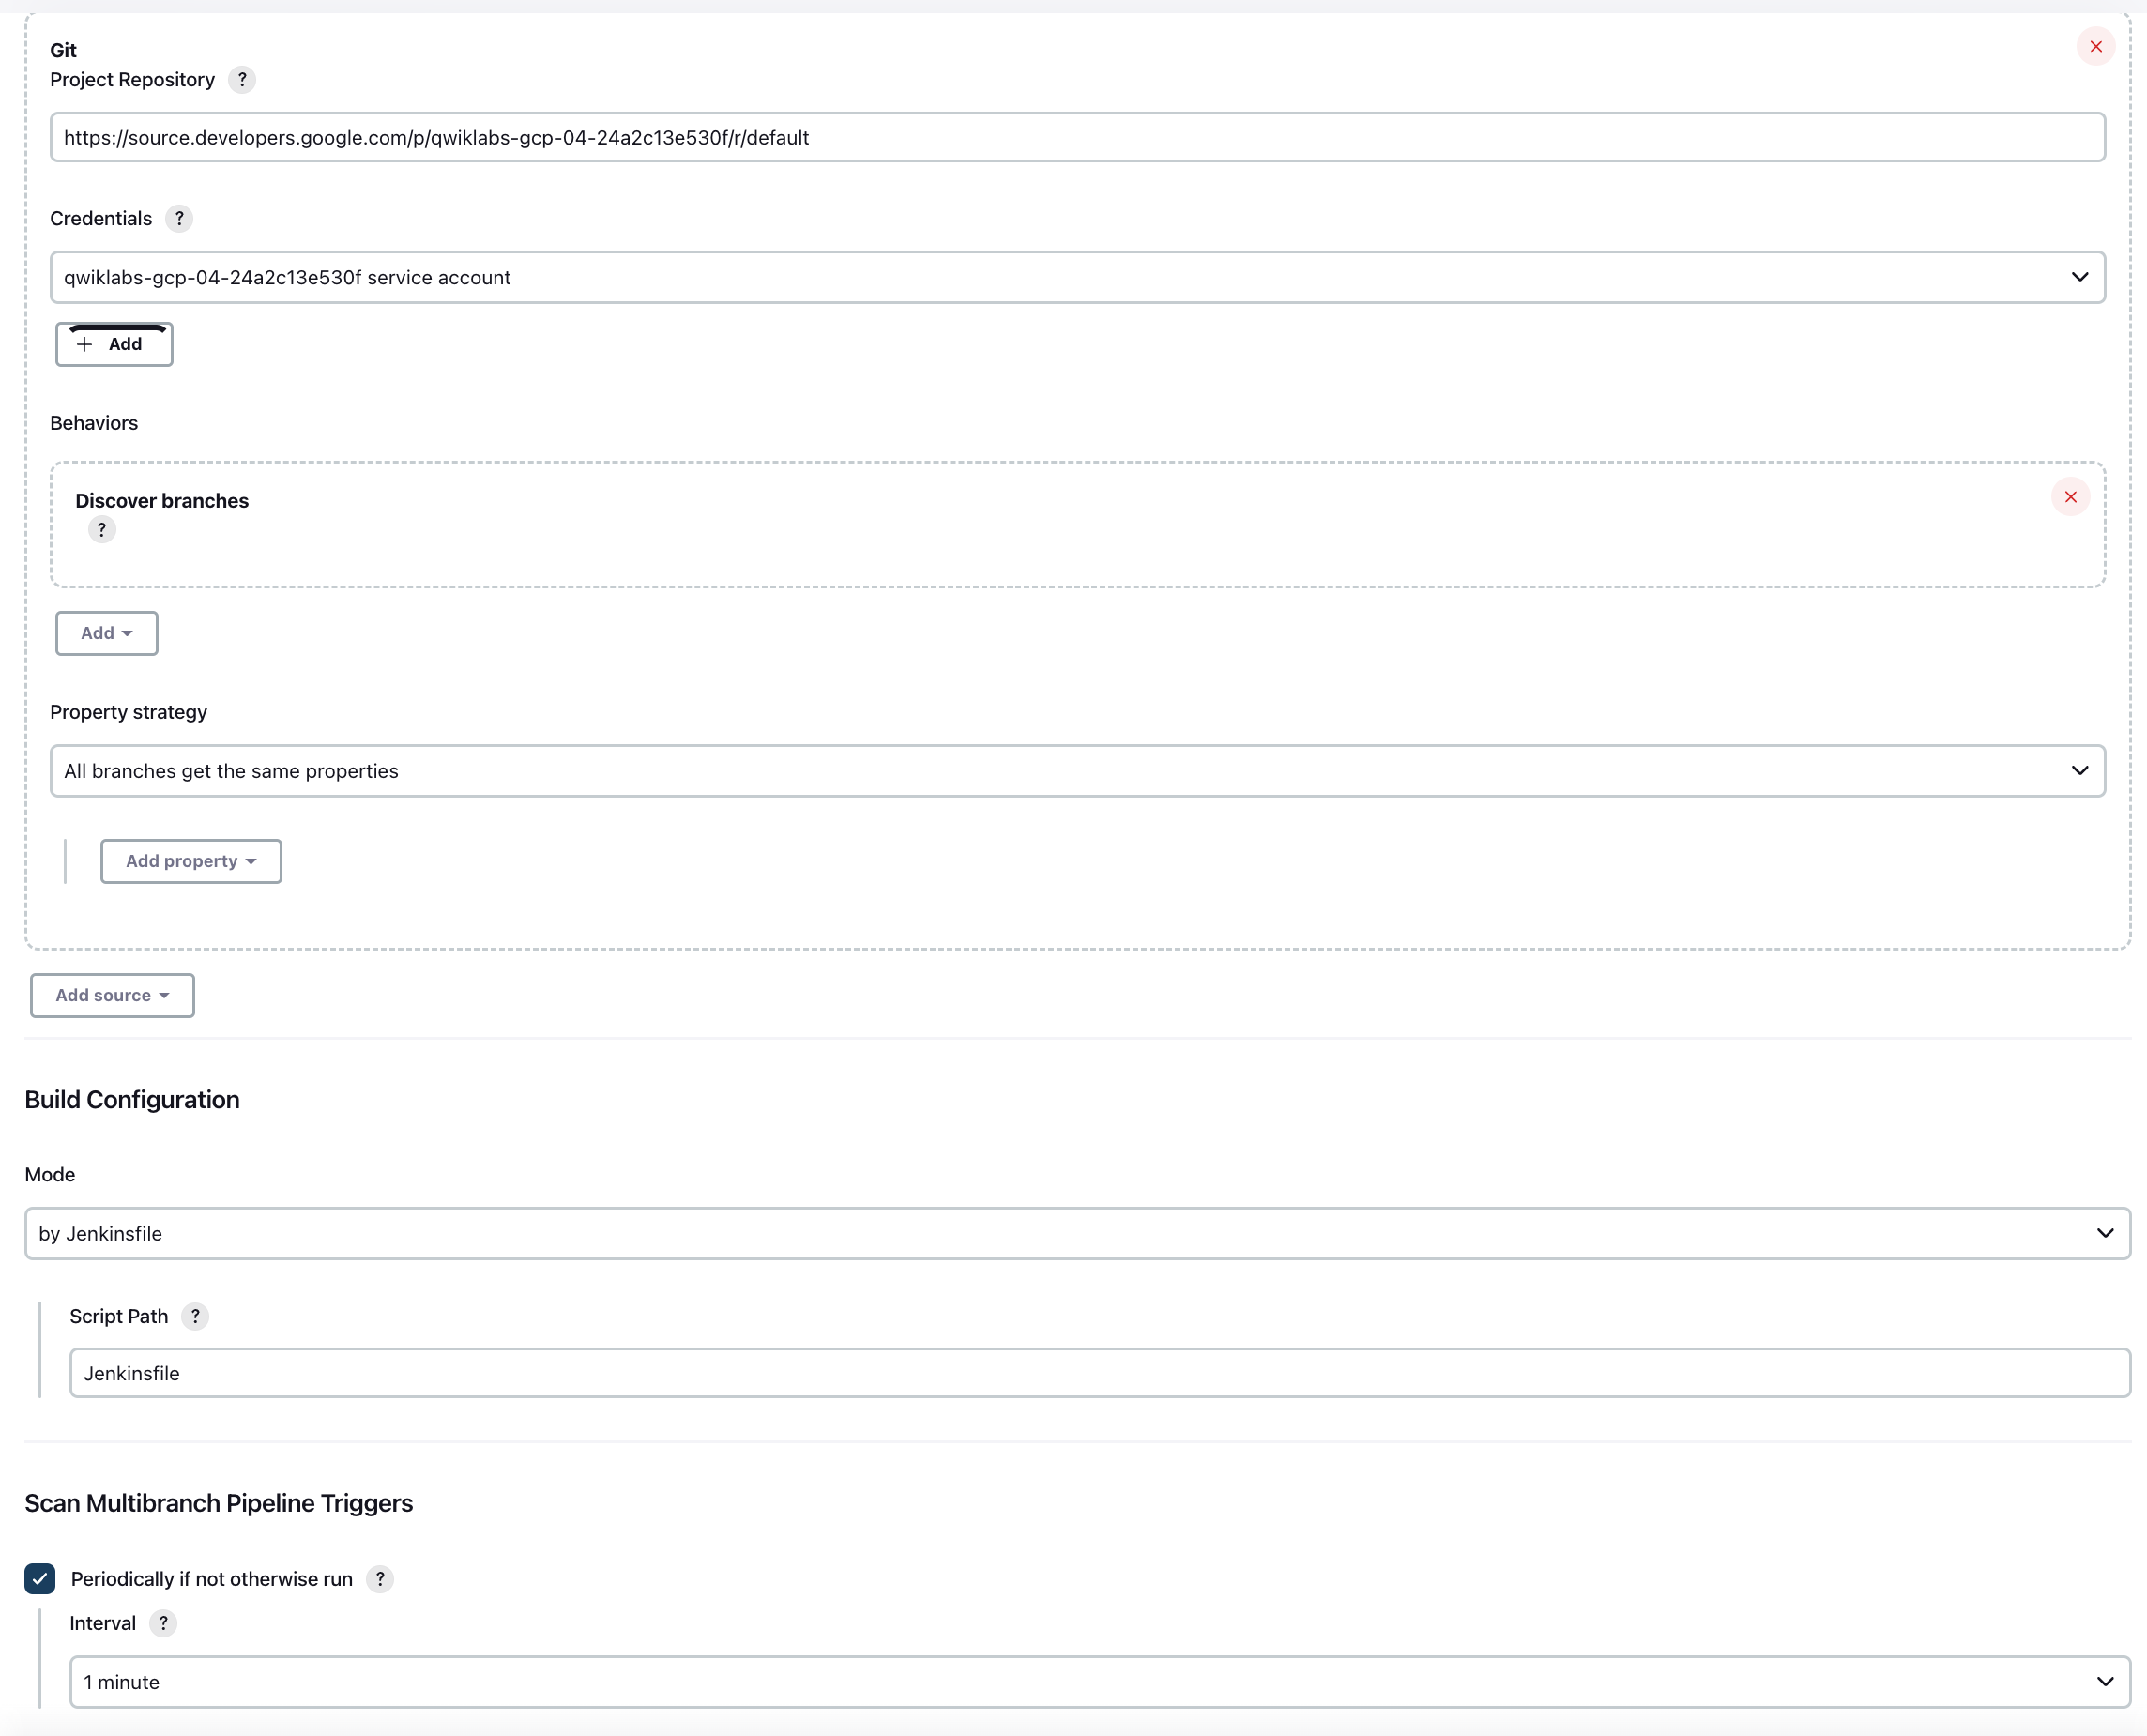
On the next page, in the Branch Sources section, select Git from Add Source dropdown.
Paste the HTTPS clone URL of your sample-app repo in Cloud Source Repositories into the Project Repository field. Replace
[PROJECT_ID]with your Project ID:
From the Credentials drop-down, select the name of the credentials you created when adding your service account in the previous steps.
Under Scan Multibranch Pipeline Triggers section, check the Periodically if not otherwise run box and set the Interval value to 1 minute.
Your job configuration should look like this:
- Click Save leaving all other options with their defaults.
After you complete these steps, a job named Branch indexing runs. This meta-job identifies the branches in your repository and ensures changes haven't occurred in existing branches. If you click sample-app in the top left, the master job should be seen.
You have successfully created a Jenkins pipeline! Next, you'll create the development environment for continuous integration.
Task 9. Creating the development environment
Development branches are a set of environments your developers use to test their code changes before submitting them for integration into the live site. These environments are scaled-down versions of your application, but need to be deployed using the same mechanisms as the live environment.
Creating a development branch
To create a development environment from a feature branch, you can push the branch to the Git server and let Jenkins deploy your environment.
Create a development branch and push it to the Git server:
Modifying the pipeline definition
The Jenkinsfile that defines that pipeline is written using the Jenkins Pipeline Groovy syntax. Using a Jenkinsfile allows an entire build pipeline to be expressed in a single file that lives alongside your source code. Pipelines support powerful features like parallelization and require manual user approval.
In order for the pipeline to work as expected, you need to modify the Jenkinsfile to set your project ID.
Open the Jenkinsfile in your terminal editor, for example
vi:
Start the editor:
Add your
PROJECT_IDto theREPLACE_WITH_YOUR_PROJECT_IDvalue. (YourPROJECT_IDis your Project ID found in theCONNECTION DETAILSsection of the lab. You can also rungcloud config get-value projectto find it.Change the value of
CLUSTER_ZONEto<filled in at lab start>gcloud config get compute/zone.
Save the
Jenkinsfilefile: hit Esc then (forviusers):
Modify the site
To demonstrate changing the application, you will change the gceme cards from blue to orange.
Open
html.go:
Start the editor:
Change the two instances of
<div class="card blue">with following:
Save the
html.gofile: press Esc then:
Open
main.go:
Start the editor:
- The version is defined in this line:
Update it to the following:
Save the main.go file one more time: Esc then:
Task 10. Kick off Deployment
Commit and push your changes:
This will kick off a build of your development environment.
After the change is pushed to the Git repository, navigate to the Jenkins user interface where you can see that your build started for the new-feature branch. It can take up to a minute for the changes to be picked up.
- After the build is running, click the down arrow next to the build in the left navigation and select Console output:
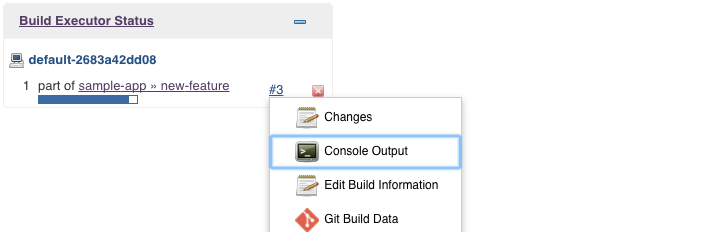
- Track the output of the build for a few minutes and watch for the
kubectl --namespace=new-feature apply...messages to begin. Your new-feature branch will now be deployed to your cluster.
If you didn't see anything in Build Executor, not to worry. Just go to the Jenkins homepage > sample app. Verify that the new-feature pipeline has been created.
Once that's all taken care of, start the proxy in the background:
If it stalls, press Ctrl + C to exit out. Verify that your application is accessible by sending a request to
localhostand lettingkubectlproxy forward it to your service:
You should see it respond with 2.0.0, which is the version that is now running.
If you receive a similar error:
- It means your frontend endpoint hasn't propagated yet—wait a little bit and try the
curlcommand again. Move on when you get the following output:
You have set up the development environment! Next, you will build on what you learned in the previous module by deploying a canary release to test out a new feature.
Task 11. Deploying a canary release
You have verified that your app is running the latest code in the development environment, so now deploy that code to the canary environment.
Create a canary branch and push it to the Git server:
In Jenkins, you should see the canary pipeline has kicked off. Once complete, you can check the service URL to ensure that some of the traffic is being served by your new version. You should see about 1 in 5 requests (in no particular order) returning version
2.0.0.
- If you keep seeing 1.0.0, try running the above commands again. Once you've verified that the above works, end the command with Ctrl + C.
That's it! You have deployed a canary release. Next you will deploy the new version to production.
Task 12. Deploying to production
Now that our canary release was successful and we haven't heard any customer complaints, deploy to the rest of your production fleet.
Create a canary branch and push it to the Git server:
In Jenkins, you should see the master pipeline has kicked off.
Once complete (which may take a few minutes), you can check the service URL to ensure that all of the traffic is being served by your new version, 2.0.0.
- Once again, if you see instances of
1.0.0try running the above commands again. You can stop this command by pressing Ctrl + C.
Example output:
You can also navigate to site on which the gceme application displays the info cards. The card color changed from blue to orange.
Here's the command again to get the external IP address so you can check it out:
Example output:

Comments
Post a Comment